Ongoing epidemiological analyses of COVID-19 in Belgium
Published on April 19, 2020, by Simon Dellicour & Marius Gilbert
Contents
The Spatial Epidemiology Lab is actively involved in several real-time analyses dedicated to the COVID-19 epidemic in Belgium. Here is an overview of ongoing analyses and preliminary results. All the scripts written and used to perform these analyses are available on the following GitHub repo. Please note that the content of this page (and GitHub repo) will be regularly updated to rapidly share updated or new results. Spatial analyses are performed in collaboration with the research teams of Catherine Linard (UNamur), Sophie Vanwambeke (UCL), and Niel Hens (UHasselt), and phylogenetic analyses are performed in collaboration with the research teams of Piet Maes and Guy Baele from the Rega Institute (KU Leuven), as well as the teams of Marie-Pierre Hayette, Vincent Bours and Keith Durkin (ULiège).
Investigating the evolution of doubling times
To follow the progression of the epidemic and quantify the impact of lockdown measures, we frequently estimate several metrics as the doubling time associated with the number of hospitalisations. The doubling time is here defined as the number of days needed to double the number of infected people hospitalised in Belgium. We here focus on the number of hospitalisations rather than on the number of positive cases, which is directly function of the testing effort and strategy themself evolving through time. Therefore, we consider the number of hospitalisations as a more reliable proxy to follow the epidemiological trend. Furthermore, analysing the number of hospitalisations is of primary interest regarding the objective to remain below the saturation threshold of hospitals. We first aim to estimate the evolution of such doubling time per province:
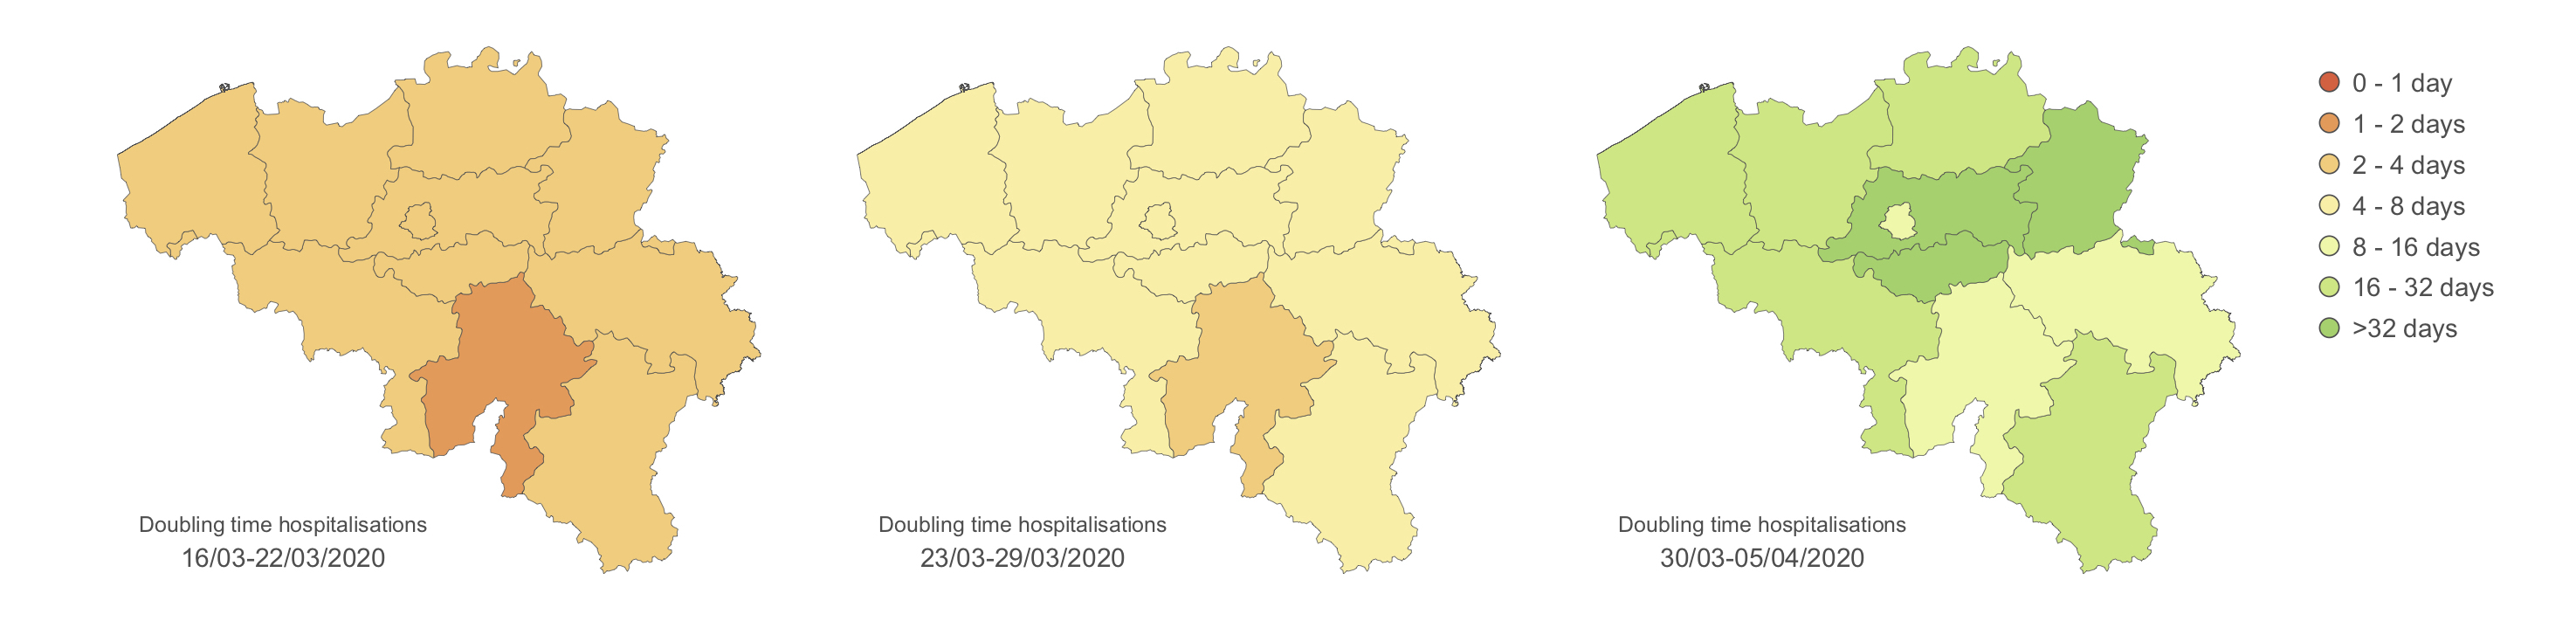
We have also defined hospital catchment areas based on travel time to the closest hospital, which allows to follow the situation per hospital. These estimates confirm the impact of lockdown measures but also highlight some differences among provinces or hospital catchment areas. The plan is now to test the association between several epidemiological metrics (e.g. COVID-19 hospitalisation incidence, growth rate, and doubling time) and several covariates (e.g. demographic, socio-economic, environmental, and behavioural variables).
Analysing the lockdown with mobile phone data
Along with our collaborators, we also have the perspective to exploit anonymised and aggregated mobile phone data to quantify and monitor the effect of lockdown measures on mobility. The analysis of such data could for instance allow to detect potential increase in overal mobility despite lockdown measures, which could in turn indicate the short-term risk to observe an increase in the number of hospitalisations.
Phylogenetic and phylogeographic investigations
In Belgium, several labs are sequencing SARS-CoV-2 genomes (Rega Institute, KU Leuven; GIGA Medical Genomics, ULiège; Onderzoeksgroep Virologie, UGent). Recently, the team of Dr Piet Maes (Rega Institute, KU Leuven) released >250 sequences deposited on the GISAID database. This data set represents a unique opportunity to investigate several questions related to the dispersal history and dynamic of SARS-CoV-2 in Belgium: origin of introductions into the Belgian territory (phylogeographic analysis currently running), relative importance of external introductions in establishing Belgian clusters of transmission, spatio-temporal distribution of these clusters, etc.
These new sequences were immediately integrated in the phylogenetic reconstruction available on the online plateform Nextstrain (Hadfield et al. 2018). Nextstrain uses the maximum likelihood method implemented in the program TreeTime (Sagulenko et al. 2018) to infer a time-scaled phylogenetic tree in a really short amount of time. Here, we take advantage of this already inferred tree to reconstruct and analyse the dispersal history of SARS-CoV-2 lineages in Belgium. In practice, we use the Nextstrain tree as a fixed empirical tree along which we infer the ancestral locations using the discrete diffusion process (Lemey et al. 2009) implemented in the software package BEAST 1.10 (Suchard et al. 2018). While we acknowledge that a fully integrated analysis (i.e. an analysis where the phylogenetic tree and ancestral locations are jointly inferred) would be preferable, fixing an empirical tree represents a good compromise to quickly gain insights on the dispersal history and dynamics of SARS-CoV-2 lineages. Indeed, the amount of genomes available, as well as the number of different discrete locations to consider in the analysis, would lead to a joint analysis running for weeks in a Bayesian framework like BEAST. Given the present situation, we deliberately chose to use the Nextstrain tree as a good estimate of the true time-scaled phylogenetic tree. Furthermore, this framework also allows us to frequently update the analysis.
In a first time and in order to focus on Belgium, we have only considered two possible ancestral locations, i.e. “Belgium” and “outside Belgium”:
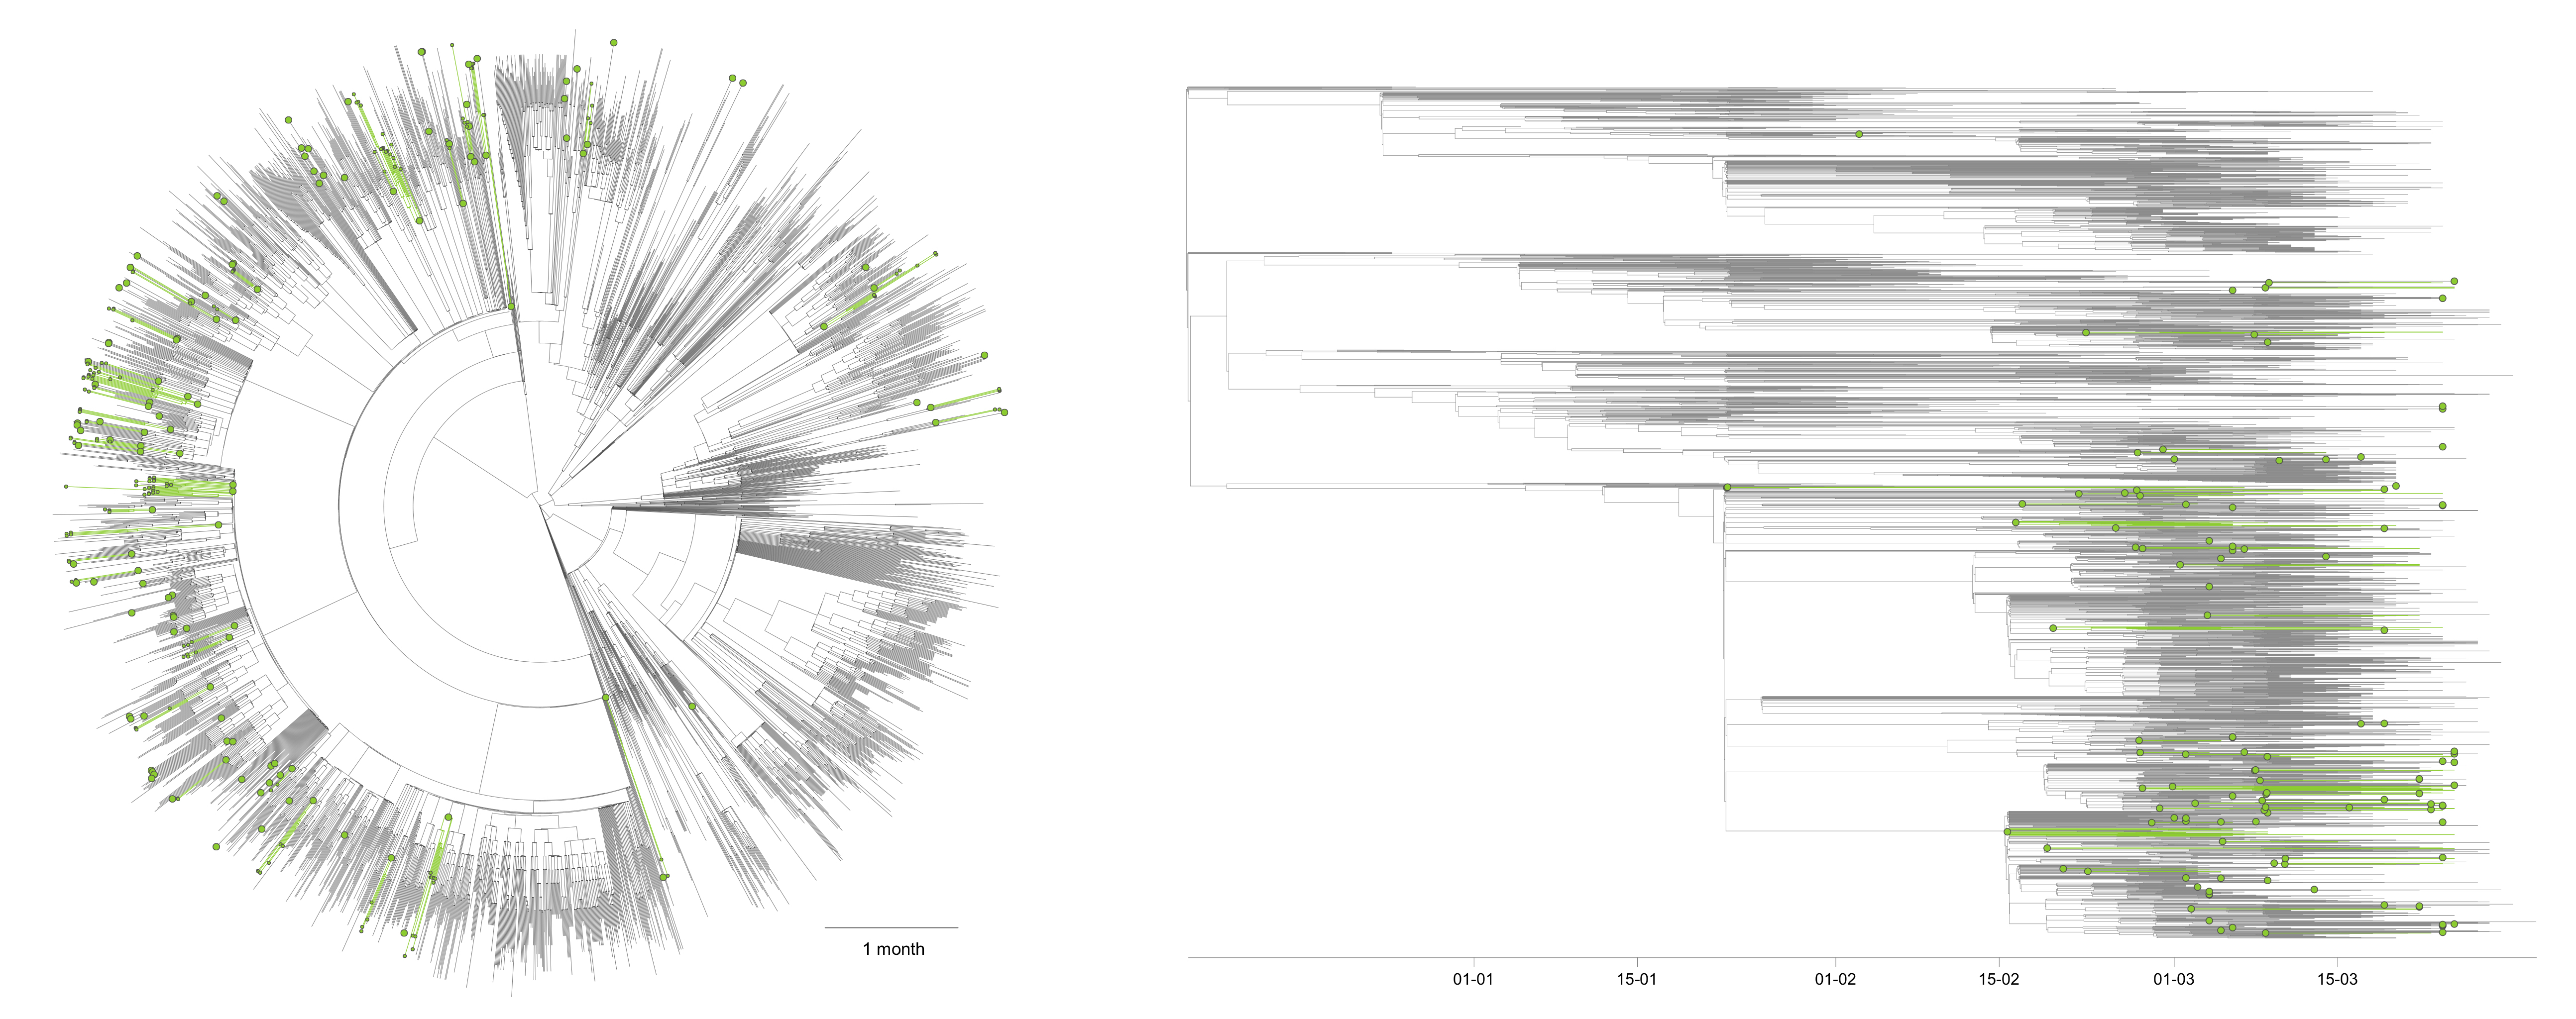
On this overall tree, you can visualise inferred Belgian clusters (green branches/clades) as well as their most ancestral node identified in the tree (green internal nodes). We identified a minimum number of 125 lineage introductions (95% HPD interval = [112-139]), which gives the relative importance of external introduction considering the number of sequences currently sampled in Belgium (253). While each inferred Belgian cluster should correspond to a distinct introduction in the country, the estimated age of the most ancestral node (green internal node) of each of these clusters does not necessarily correspond to the estimated moment of introduction of that lineage in Belgium. Indeed, if we consider an actual introduction leading to a cluster of 1000 infections for which we sequenced 5 genomes, the green node is the most recent ancestor of these 5 genomes within that cluster, not the most recent ancestor of all lineages in that cluster.
Two main conclusions so far: (i) the relative importance of external introduction is relatively important, (ii) the clusters resulting from these introductions are widely distributed across the country. The main perspective with this second aspect is now to assess if this pattern will evolve while including more sequences sampled during the lockdown. These analyses are based on sequences available on the 7th April, but in the future, we will update these analyses with newly available sequences.
References
Hadfield J, Megill C, Bell SM, Huddleston J, Potter B, Callender C, Sagulenko P, Bedford T, Neher RA (2018). Nextstrain: Real-time tracking of pathogen evolution. Bioinformatics 34: 4121–4123
Lemey P, Rambaut A, Drummond AJ, Suchard MA (2009). Bayesian phylogeography finds its roots. PLoS Computational Biology 5: e1000520
Sagulenko P, Puller V, Neher RA (2018). TreeTime: Maximum-likelihood phylodynamic analysis. Virus Evolution 4: vex042
Suchard MA, Lemey P, Baele G, Ayres DL, Drummond AJ, Rambaut A (2018). Bayesian phylogenetic and phylodynamic data integration using BEAST 1.10. Virus Evolution 4: vey016