A phylodynamic workflow to rapidly gain insights into the dispersal history and dynamics of SARS-CoV-2 lineages
Published on June 16, 2020, by Simon Dellicour
Since the start of the COVID-19 pandemic, an unprecedented number of genomic sequences of the causative virus (SARS-CoV-2) have been publicly released. The resulting volume of available genetic data presents a unique opportunity to gain real-time insights into the pandemic, but also a daunting computational hurdle if analysed with gold-standard phylogeographic methods. We here describe and apply an analytical pipeline that is a compromise between fast and rigorous analytical steps. As a proof of concept, we focus on Belgium, one of the countries with the highest spatial density of sequenced SARS-CoV-2 genomes. At the global scale, our analyses confirm the importance of external introduction events in establishing transmission chains in the country. At the country scale, our spatially-explicit phylogeographic analyses highlight that the national lockdown had a relatively low impact on both the lineage dispersal velocity and the long-distance dispersal events. This latter result contrasts with estimates previously obtained when analysing a smaller data set including less sequences sampled during the lockdown period. Our pipeline has the potential to be quickly applied to other countries or regions, with key benefits in complementing epidemiological analyses in assessing the impact of intervention measures or their progressive easement. Read the whole study here.
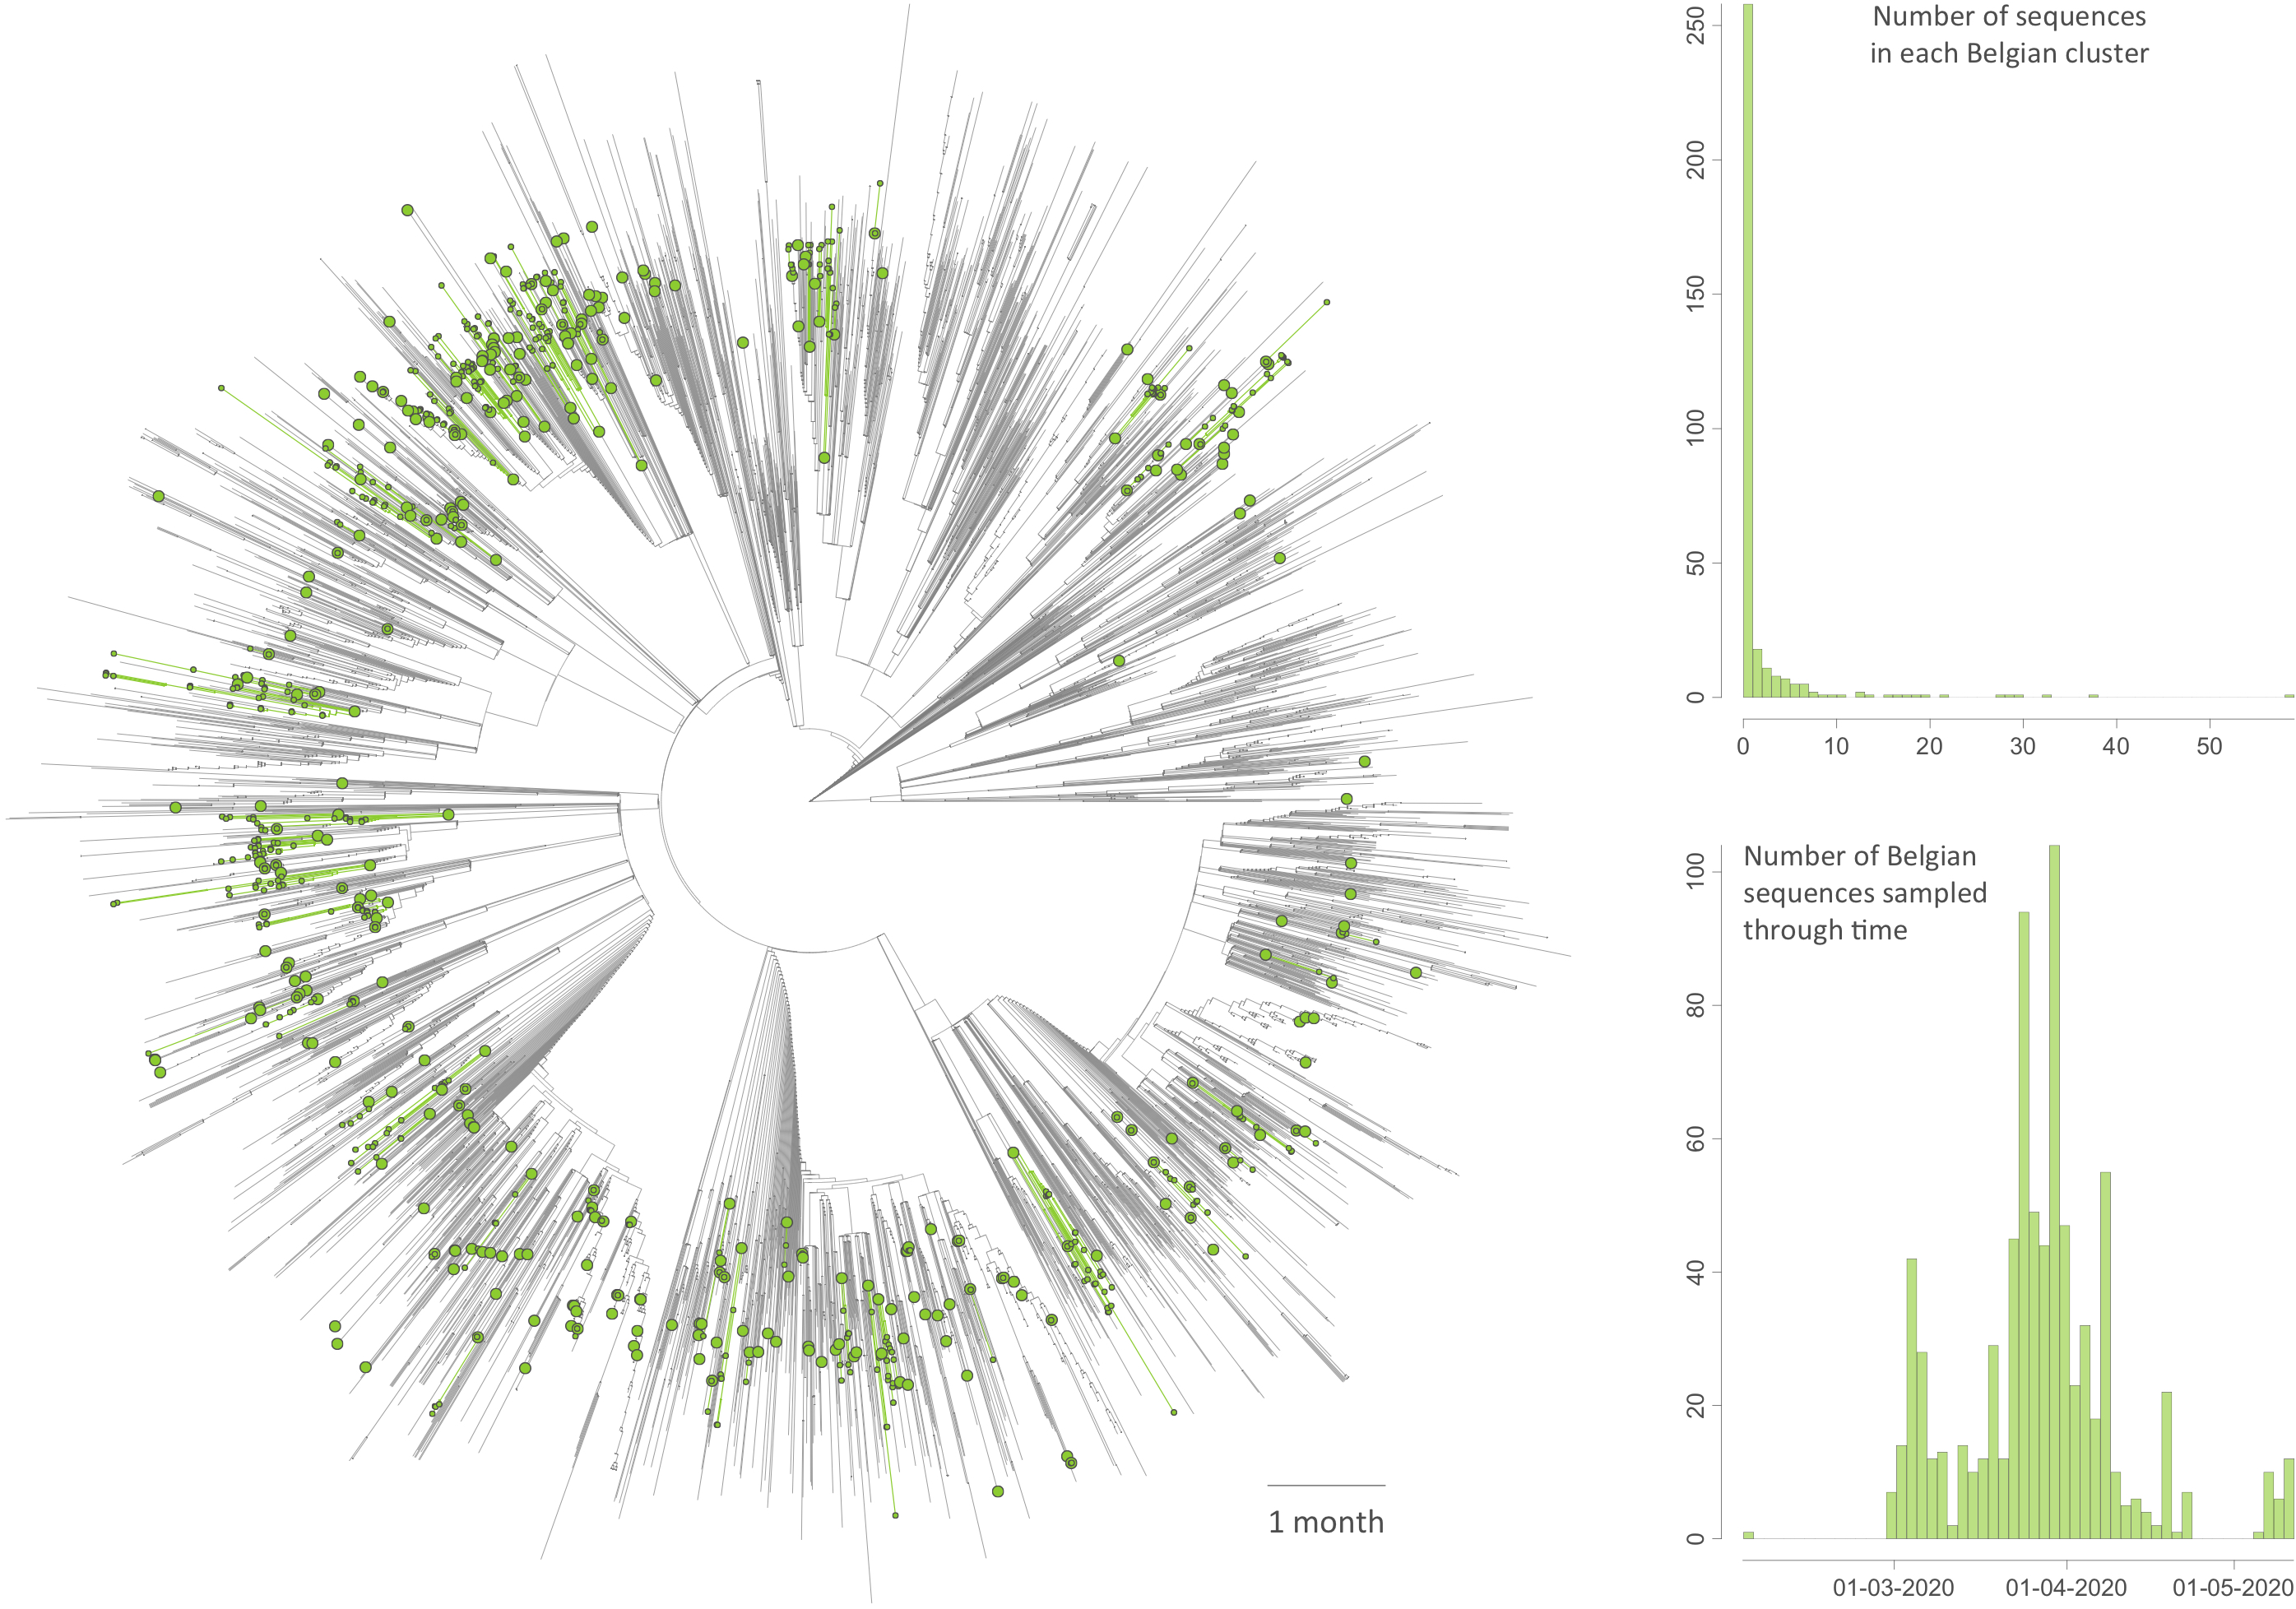
Figure: time-scaled phylogenetic tree in which we identified Belgian clusters. A cluster is here defined as a phylogenetic clade likely corresponding to a distinct introduction into the study area (Belgium). We delineated these clusters by performing a simplistic discrete phylogeographic reconstruction along the time-scaled phylogenetic tree while only considering two potential ancestral locations: “Belgium” and “non-Belgium”. We identified a minimum number of 331 lineage introductions (95% HPD interval = [315-344]), which gives the relative importance of external introductions considering the number of sequences currently sampled in Belgium (740). On the tree, lineages circulating in Belgium are highlighted in green, and green nodes correspond to the most ancestral node of each Belgian cluster. Besides the tree, we also report the distribution of cluster sizes (number of sampled sequences in each cluster) as well as the number of sequences sampled through time.
Reference: Dellicour S, Durkin K, Hong SL, Vanmechelen B, Martí-Carreras J, Gill MS, Meex C, Bontems S, André E, Gilbert M, Walker C, De Maio N, Hadfield J, Hayette MP, Bours V, Wawina-Bokalanga T, Artesi M, Baele G, Maes P (201). A phylodynamic workflow to rapidly gain insights into the dispersal history and dynamics of SARS-CoV-2 lineages. Molecular Biology & Evolution 38: 1608-1613