How fast are viruses spreading in the wild? Checked out our new study now published in PLoS Biology
Published on December 03, 2024, by Simon Dellicour
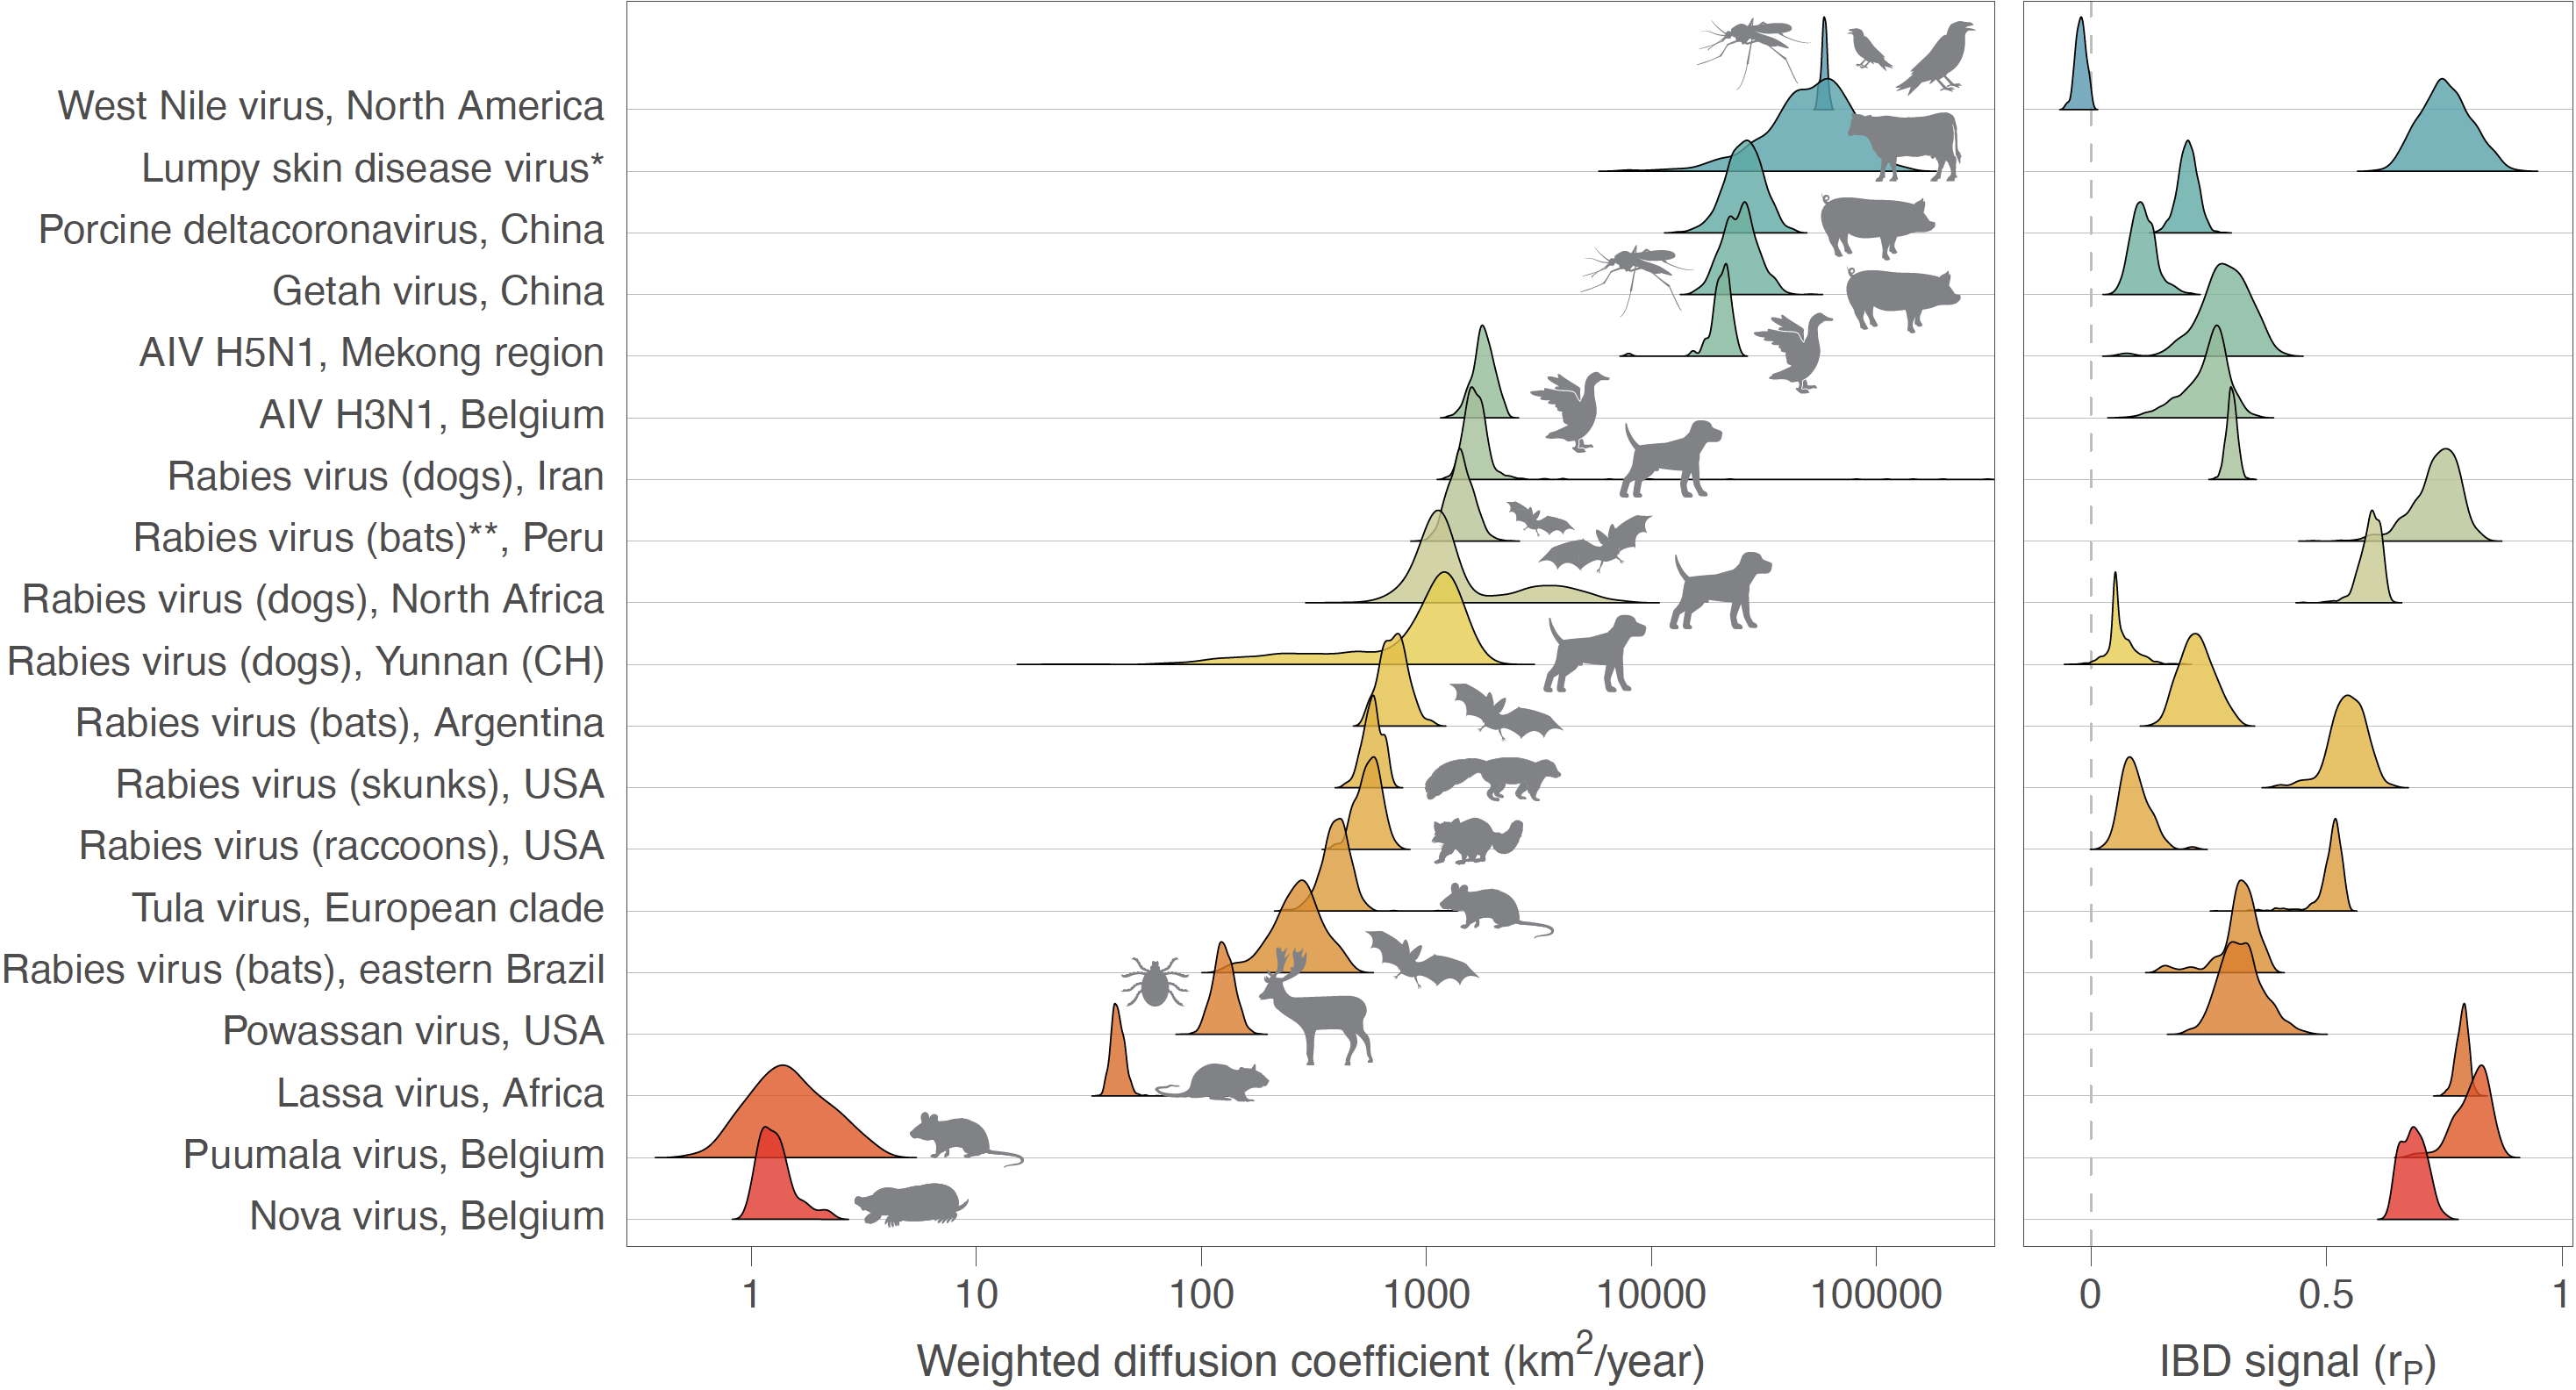
Our new study entitled “How fast are viruses spreading in the wild?” has just been published in PLoS Biology. Genomic data collected from viral outbreaks can be exploited to reconstruct the dispersal history of viral lineages in a two-dimensional space using continuous phylogeographic inference. These spatially explicit reconstructions can subsequently be used to estimate dispersal metrics that can be informative of the dispersal dynamics and the capacity to spread among hosts. Heterogeneous sampling efforts of genomic sequences can however impact the accuracy of phylogeographic dispersal metrics. While the impact of spatial sampling bias on the outcomes of continuous phylogeographic inference has previously been explored, the impact of sampling intensity (i.e., sampling size) when aiming to characterise dispersal patterns through continuous phylogeographic reconstructions has not yet been thoroughly evaluated. In our study, we use simulations to evaluate the robustness of three dispersal metrics — a lineage dispersal velocity, a diffusion coefficient, and an isolation-by-distance signal metric — to the sampling intensity. Our results reveal that both the diffusion coefficient and isolation-by-distance signal metrics appear to be the most robust to the number of samples considered for the phylogeographic reconstruction. We then use these two dispersal metrics to compare the dispersal pattern and capacity of various viruses spreading in animal populations. Our comparative analysis reveals a broad range of isolation-by-distance patterns and diffusion coefficients mostly reflecting the dispersal capacity of the main infected host species but also, in some cases, the likely signature of rapid and/or long-distance dispersal events driven by human-mediated movements through animal trade. Overall, our study provides key recommendations for the use of lineage dispersal metrics to consider in future studies and illustrates their application to compare the spread of viruses in various settings. Read the whole study here.

Figure: comparison of dispersal metrics estimated for different genomic datasets of viruses spreading in animal populations. Specifically, we here report posterior estimates obtained for two metrics estimated from trees sampled from the posterior distribution of a Bayesian continuous phylogeographic inference: the weighted diffusion coefficient and the isolation-by-distance (IBD) signal estimated by the Pearson correlation coefficient (rP) between the patristic and log-transformed great-circle geographic distances computed for each pair of virus samples. We report the posterior distribution of both metrics estimated through continuous phylogeographic inference for the following datasets: West Nile virus in North America [32], Lumpy skin disease virus [11], Porcine deltacoronavirus in China [34], Getah virus in China [35], avian influenza virus (AIV) in the Mekong region [36] and H3N1 in Belgium [37], rabies virus (dogs) in Iran [38], rabies virus (bats) in Peru [39], rabies virus (dogs) in northern Africa [40,41], rabies virus (bats) in Argentina [42], rabies virus (skunks) in the USA [43], rabies virus (raccoons) in the USA [44], Tula virus in central Europe [45], rabies virus (bats) in eastern Brazil [46], Powassan virus in the USA [47], Lassa virus in Africa [48], Puumala virus in Belgium [49], and Nova virus in Belgium [50]. (*) Estimates based on the analysis of the wild-type strains (see [11] for further detail); (**) estimates based on the combined analysis of lineages L1 and L3. See also Table S1 for the related 95% highest posterior density (HPD) intervals and number of samples associated with each dataset.
If you would like to compare the dispersal capacity and pattern associated with a continuous phytogeographic reconstruction that you conducted for a virus spreading in animal population(s), feel free to contact us to extend this figure with the estimates based on your dataset. The resulting figure and/or associated comparison will then be available for your study.
R scripts related to the analyses based on simulated and real datasets are all available, along with the associated input/output files, on a dedicated GitHub repo. Continuous phylogeographic simulations and dispersal statistics were respectively conducted and computed using the R package “seraphim” (see also the updated “seraphim” tutorial on the estimation of dispersal statistics available here).
Reference: Dellicour S, Bastide P, Rocu P, Fargette D, Hardy OJ, Suchard MA, Guindon S, Lemey P (2024). How fast are viruses spreading in the wild? PLoS Biology* 22: e3002914