New study on the emergence and dissemination of the SARS-CoV-2 variant XBB.1.5 in New York
Published on June 02, 2024, by Fabiana Gámbaro
Our new study on the emergence and dissemination of the SARS-CoV-2 variant XBB.1.5 in New York has been published in Virus Evolution. The recombinant SARS-CoV-2 Omicron XBB.1.5 variant was first detected in New York City (NYC) and rapidly became the predominant variant in the area by early 2023. The increased occurrence of circulating variants within the SARS-CoV-2 XBB-sublineage prompted the modification of COVID-19 mRNA vaccines by Moderna and Pfizer-BioNTech. This update, implemented in mid-September 2023, involved the incorporation of a monovalent XBB.1.5 component. Considering that NYC probably played a central role in the emergence of the XBB.1.5 variant, we conducted phylogeographic analysis to investigate the emergence and spread of this variant in the metropolitan area. Our analysis confirms that XBB.1.5 emerged within or near the NYC area and indicates that XBB.1.5 had a diffusion velocity similar to that of the variant Alpha in the same study area. Additionally, the analysis of 2,392 genomes collected in the context of the genomic surveillance program at NYU Langone Health system showed that there was no increased proportion of XBB.1.5, relative to all cocirculating variants, in the boosted compared to unvaccinated individuals. This study provides a comprehensive description of the emergence and dissemination of XBB.1.5. Read the whole study here.
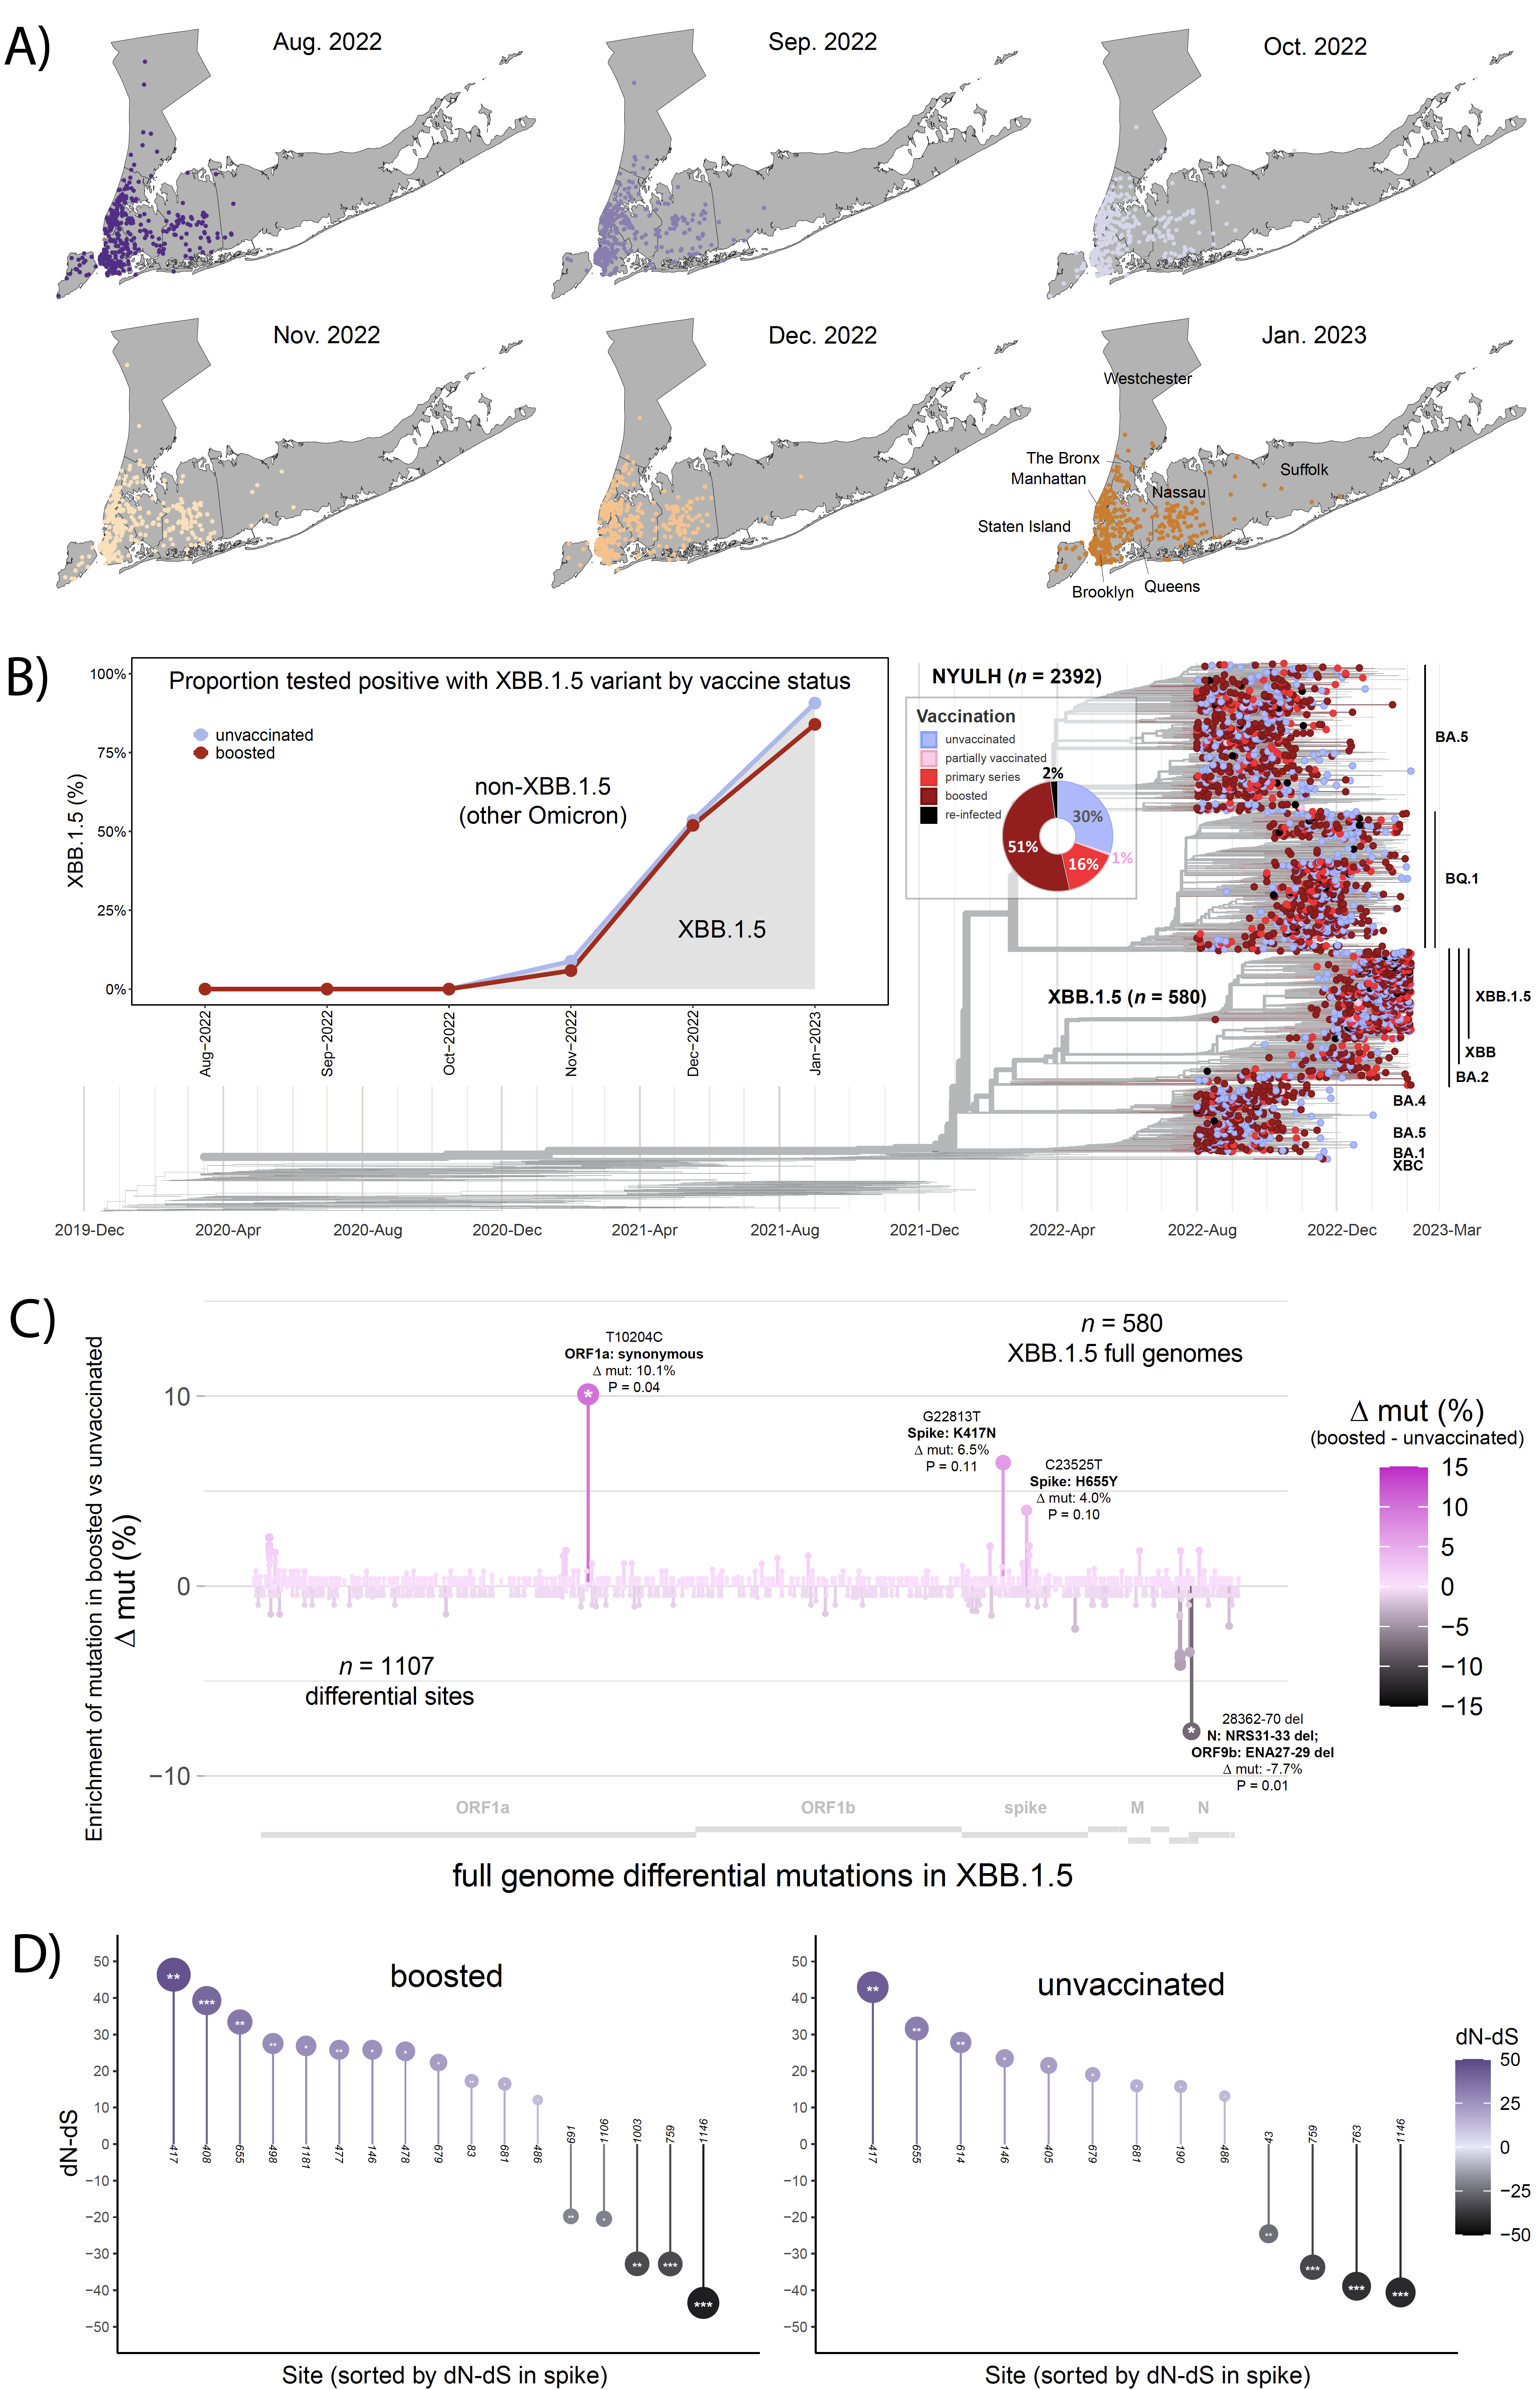
Figure 1: XBB.1.5 global distribution, lineage prevalence, and mutation analyses by vaccine status. (A) Geographic distribution of SARS-CoV-2 samples collected by the NYULH genomic surveillance effort between 1 August 2022 and 4 February 2023 in the NYC area per month. The last plot corresponds to the month of January 2023 until 4 February 2023. (B) Time-calibrated maximum-likelihood tree of North America-focused global SARS-CoV-2 sequences, filtered for the 2,392 NYULH sequences collected in the state of New York and annotated by vaccination/re-infection status. Pie chart indicates distribution by vaccination/re-infection status. Box: probability of detection of XBB.1.5 by month in boosted (red) individuals compared to unvaccinated individuals (grey), adjusted for month of test, sex, and age of the participants. (C) Site-specific spike mutation analysis in SARS-CoV-2 booster vaccine breakthrough sequences compared to unvaccinated controls. The Wuhan-Hu-1 sequence served as the reference for mutation calling. The mirror plot displays differences in mutation frequencies per full genome residue between boosted and unvaccinated groups, shown along the x-axis. Bars facing up and down refer to elevated mutation frequencies in boosted and unvaccinated individuals, respectively. Study number, observed differential mutation sites (muts), and most enriched mutations are indicated. (D) Adaptive evolution analysis of all spike residues using a fast, unconstrained Bayesian approximation for inferring selection (FUBAR, Datamonkey) based on the differences of non-synonymous (dN) and synonymous (dS) mutation rates per site. The analyses were done for boosted and unvaccinated individuals infected with XBB.1.5. All sites with significant positive (facing up) and negative (facing down) selection are shown along the x-axis. The dots are coloured in a gradient based on the dN-dS value, as indicated in the legend. Their size corresponds to the absolute value of the dN-dS value. The y-axis displays the difference of non-synonymous and synonymous mutation rates per site. Posterior probabilities (PP) > 0.9 are considered significant and are indicated by asterisks inside the circles.
Reference: Gambaro F, Duerr R, Dimartino D, Marier C, Iturrate E, Mulligan MJ, Heguy A, Dellicour S (2024). Emergence and dissemination of SARS-CoV-2 XBB.1.5 in New York. Virus Evolution 10: veae035